Your Guide to Immigration and the Jobs Report
Focus on (1) unemployment rates for the native- and foreign-born and (2) job growth in immigrant-reliant industries versus other industries. Ignore pretty much everything else.

This year the monthly jobs report is being widely used — and even more widely misused — to track trends in immigration and the labor market. Here is a short guide for finding data and insights about immigration in the jobs report, based on several explainers I’ve written recently at the Peterson Institute for International Economics.
Let’s start with the household survey, or more formally the Current Population Survey. Data about native-born and foreign-born residents are in Table A-7.
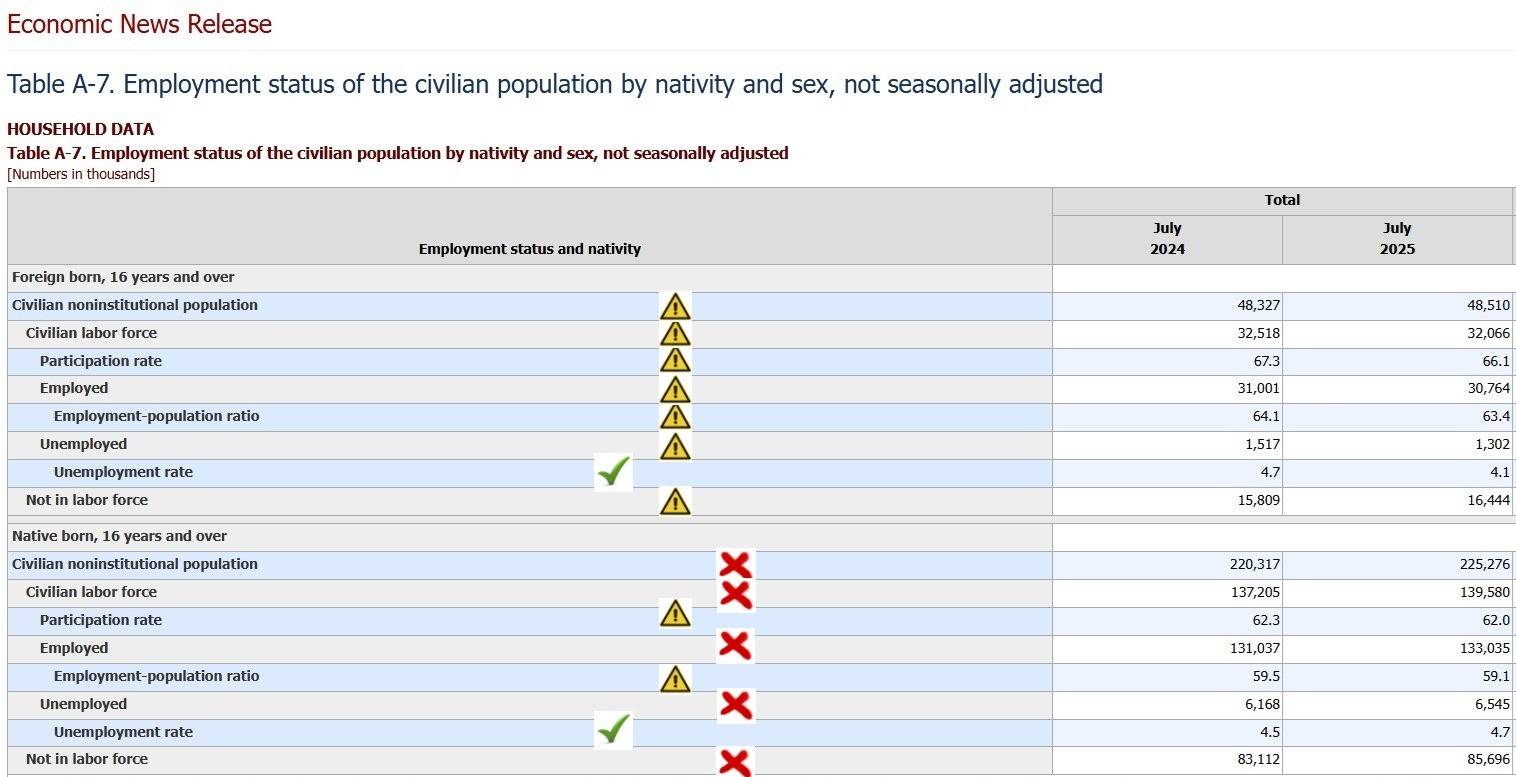
Ignore all levels and changes in levels for the native-born population. The native-born population and all numbers based on it are statistical artifacts. The huge reported jumps in native-born population and employment are meaningless. Read more about this here.
Use extreme caution with levels and changes in levels for the foreign-born population. These should never be compared across calendar years. Even within a calendar year, these levels are based on small sample sizes with large margins of error. They also are affected by different trends in response rates among foreign-born and native-born residents. The reported decline in the foreign-born population in 2025 is absurdly and implausibly large. Solid data on immigration trends in 2025 unfortunately don’t exist yet.
Use caution with the labor force participation rate and employment-population ratios. These rates and ratios do not suffer from the above issues with population and employment levels. However, still use caution. These rates and ratios are for all ages 16+, including retirees. Because the age distribution is different for the native- and foreign-born populations (the foreign-born population is younger), comparisons between native- and foreign-born LFPR and EPOP rates are not apples-to-apples.
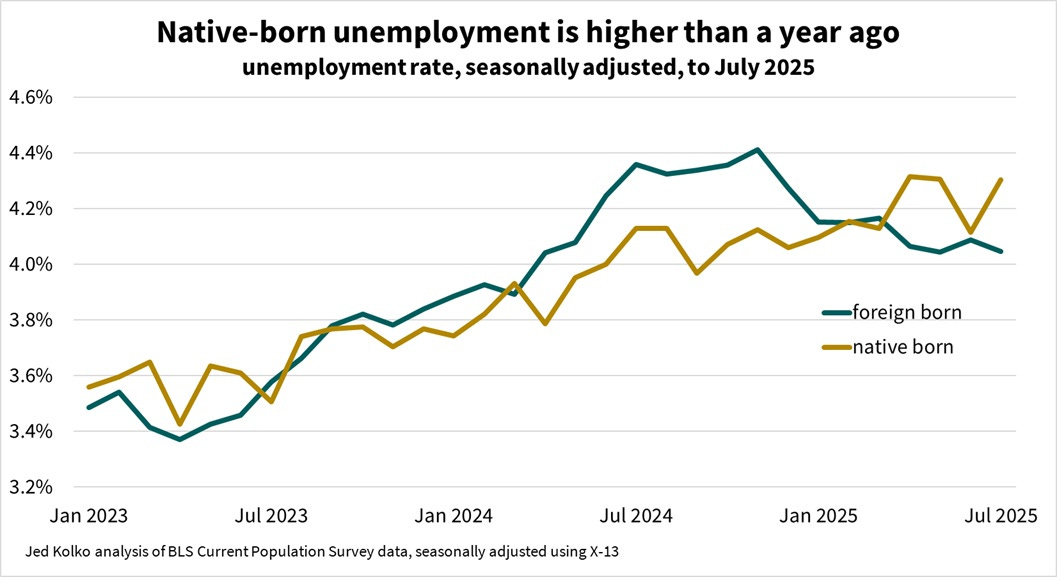
Focus on the unemployment rates for native- and foreign-born residents. These rates avoid the above pitfalls and are the best measures of how native- and foreign-born residents are faring in the labor market. Note that the unemployment rates in Table A-7 are not seasonally adjusted: the seasonally adjusted graph below shows that the unemployment rate is rising for native-born adults but has fallen for the foreign-born recently.
Onto the establishment survey, which reports nonfarm payroll employment for the economy overall and for detailed industries.
Don’t be so sure about whether that headline jobs number is good or bad. The level of job growth needed to keep the labor market steady — the “breakeven rate” — depends on how fast the adult population and labor force are growing, which depends on the rate of immigration. This year, the rate of immigration is highly uncertain. Official Census estimates, which now look outdated and too high, imply a breakeven rate of 88,000 jobs per month. In contrast, the implausibly steep drop in the foreign-born population reported in the CPS implies a breakeven rate of NEGATIVE 184,000 jobs per month. (This new blogpost walks through these alternative breakeven rates.) So, would a headline number of 10,000 jobs mean the labor market is tightening or slackening? That all depends on what you believe the current immigration rate is. To understand the macro picture, better to focus on the unemployment rate and the (prime-age or age-adjusted) employment-population ratio.
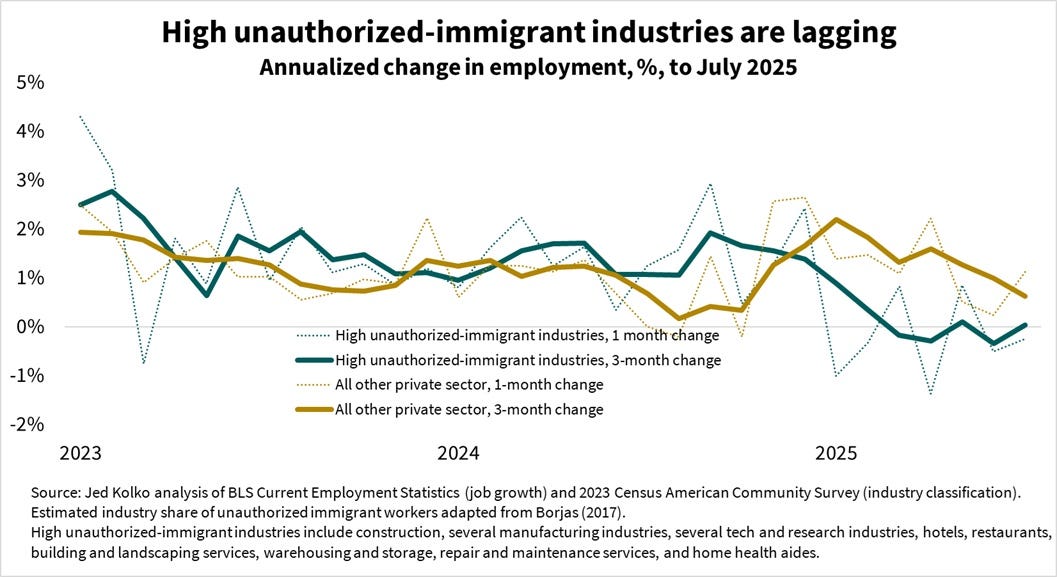
Focus on payroll employment changes in immigrant-reliant industries. Some industries, like construction and home health aide services, have a much higher share of immigrants in their workforce than many other industries do. Comparing job growth across industries shows how immigration trends are affecting the labor market. Job growth in immigrant-reliant industries has been flat in 2025, while job growth in the rest of the private sector remains positive.
I’ll update the above charts after the jobs report comes out tomorrow morning and post them on X and Bluesky.
I’m finding all of your posts on this issue extremely helpful and have to confess to being a recovered offender. One thing I’m still struggling with: while I get why we have to ignore the levels of the native-born and foreign born population and labor force, I still am a bit confused as to why the ratios are still reliable. Can we assume that both numerators and denominators are comparably distorted?