Updated: Breakeven rate for monthly payroll growth
This update incorporates the July 2025 jobs report, released August 1.

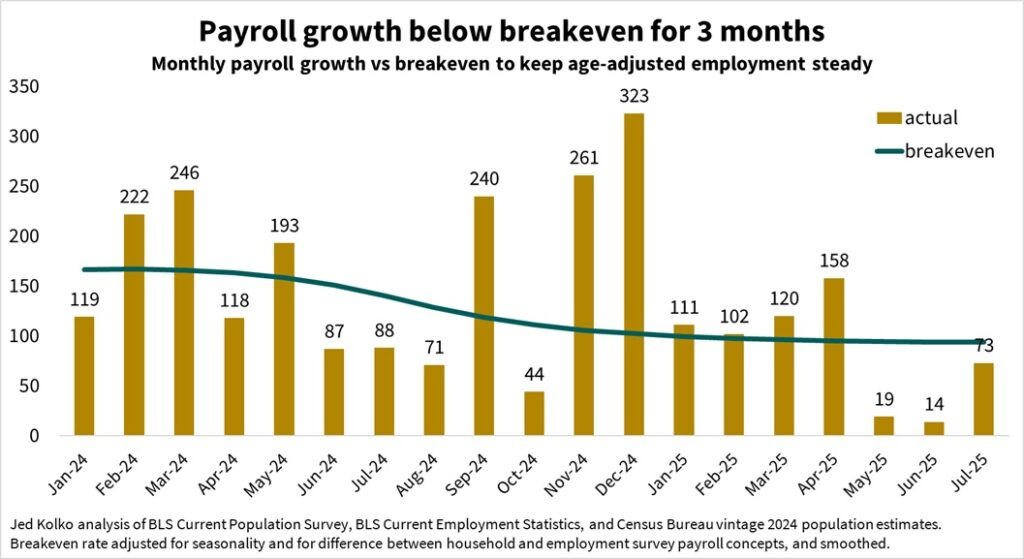
Monthly payrolls have been below the breakeven rate for the past three months, after being above breakeven for the previous six months. The breakeven rate is the level of monthly payroll growth needed to keep the age-adjusted employment-population ratio steady and is based primarily on Census population estimates. These charts update my policy brief at the Peterson Institute for International Economics website, which explains the breakeven rate and policy implications.
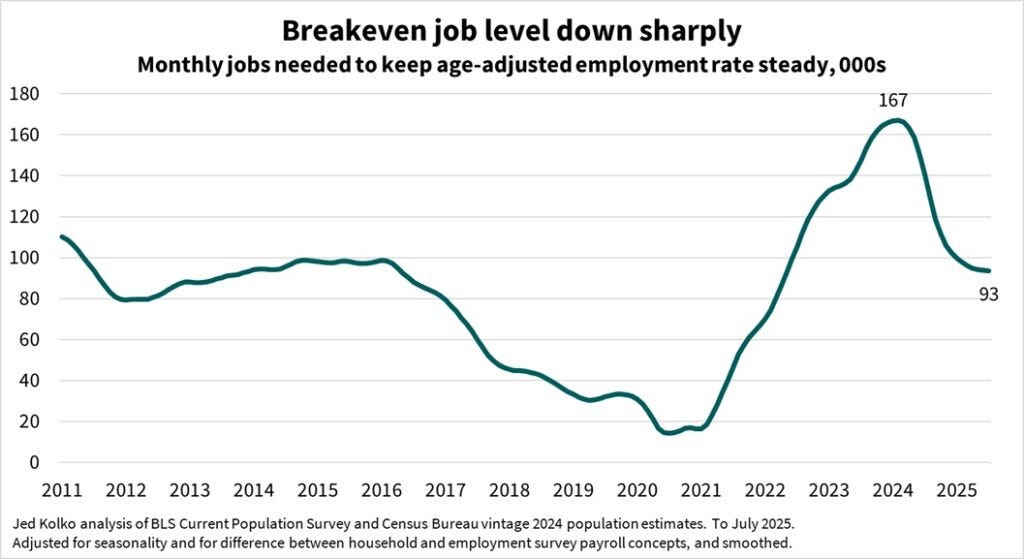
The breakeven rate is considerably below its peak in early 2024 because the immigration surge ended and the population continues to age. The current estimate is likely too high because it is based on Census population estimates that appear to assume a higher rate of immigration in 2025 than is likely. Census population estimates for 2025 imply net immigration of 1.2-1.4 million people for the year. Actual net immigration will probably be much lower and possibly near zero or negative.
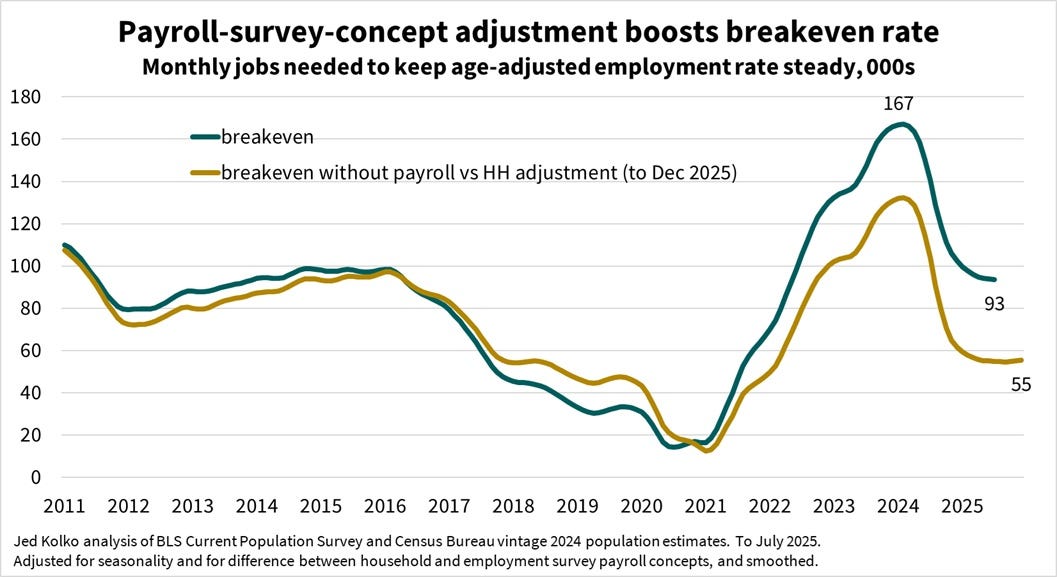
Also, the adjustment that aligns the household survey with the payroll survey concept of employment raises the breakeven rate meaningfully. Without this adjustment, the breakeven rate implied by Census population estimates is lower and will remain near 55 thousand throughout 2025.
The Excel file with the data underlying these charts is here. Questions and comments welcome.
What is the method for the calculation of breaking rate? What is the intuition?
Always appreciate your insight. Great piece!